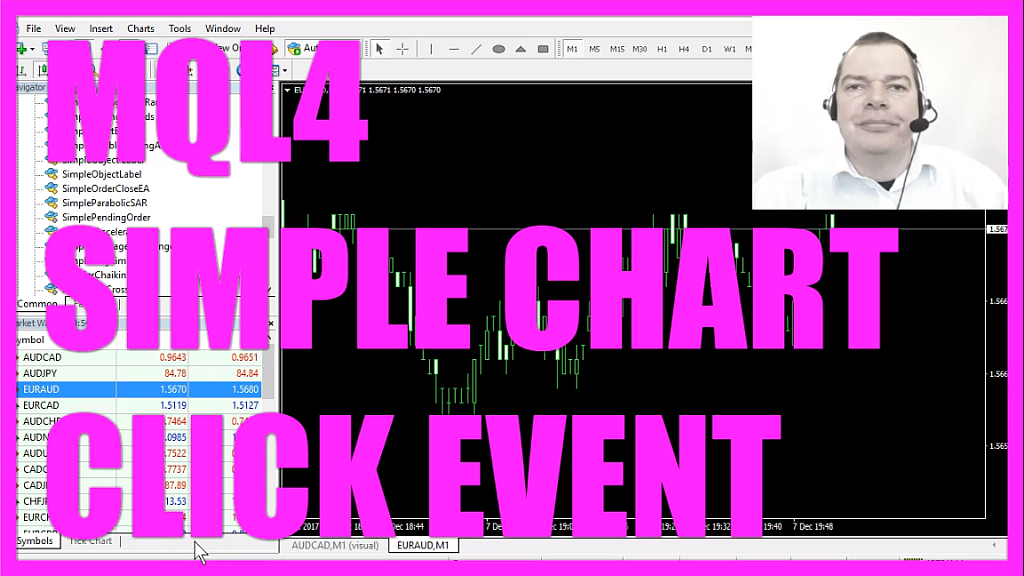
In this video I wanted to talk to you about something that is called an event. Maybe you know about events, they are pretty common in object-oriented programming. If you click on anything in your Metatrader, that’s actually an event. Pressing F2 on your keyboard will bring up the “History Center” and the reason is that; Metatrader is waiting for keystrokes, so if you press F2 it would bring up the “History Center” and if you press F4 you would see in the Metaeditor. Those events also exist on your chart, in this case I’m clicking on the chart here and here comes a message box that is telling me that the chart was clicked. It also tells me the X and the Y value. For example if I click in the upper left corner here you will see that the X value is 1 and Y value is -1. When I click the lower right corner here the value for X and Y is very high, it’s counting the number of pixels from the left upper corner. This is the X direction and this is the Y direction. So, if you know how to code an event you can use the information where somebody clicked to do something on your chart like placing a trade or setting a stop loss.
Now how can we create an Expert Advisor that is looking for chart events?
To do that please click on the little button here or press F4 in your Metatrader, and now you should see the Metaeditor window and here you want to click on “File/ New/ Expert Advisor (template)” from template. Continue. I will call this file: Simple Chart Event (SimpleChartEvent). Click on continue. Continue and finish. Now you can remove everything that is above the “OnTick” function here and let’s remove the two comment lines.
Usually we would start in the “OnTick” function here but this time we are not going to use it because “OnTick” is what happens whenever price changes.
In our case we want to check for a chart event when a mouse is clicked. If you mark that and hit F1 you will see that the “OnChartEvent” function is the handler for a group of chart events. One event for example would be the key down event when you press a key.
There are also events to change objects, and there even is an event to find out if you drag something on the chart.
The “OnChartEvent” will take a few parameters here: the first parameter is the event ID and there are three more parameters called: “lparam”, “dparam” or “sparam” for long, double, or string.
So let’s add these parameters here and like any function we need an opening and closing bracket and now we want to check if the “EventID” we have provided here equals the event “CHARTEVENT_CLICK”.
Now let’s press F1, this is the event we are looking for. You could also check for other events like: mouse move and you could even create a custom event, but for this simple example we want to check if somebody clicked on the chart. If that is the case we want to output a message box and this message box will output the text: “Chart was clicked” followed by the X value – that’s the “lparam” – and the Y value – that’s the “dparam”. This one is the headline, so let’s replace that and we only need one button so with “MB_OK” we create just a single button.
Let’s have a look at this one that’s the “MB_OK” button, you could create other buttons like: yes or no and based on what the button returns you could make another choice but one button and one option is enough for this simple example.
So let’s compile the code by pressing the little button here or hitting F7 on your keyboard and we made a mistake, we shouldn’t use a hyphen here, so let’s replace this expression, recompile the code and now it says zero errors and no warnings!
If that is the case for you please click on the little button here or press F4 to go back to Metatrader.
In Metatrader you can select any chart you like, look for the simple chart event entry in the “Navigator” window, drag it on the chart, confirm by pressing “OK” and when you click on the chart now it should say that the chart was clicked and it should also tell you the X and the Y value for your mouse click.
Okay! That’s it.
Now you know how to create an Expert Advisor that will output the coordinates of your mouse click on the chart and you have coded it yourself with a few lines of MQL4 code.


