

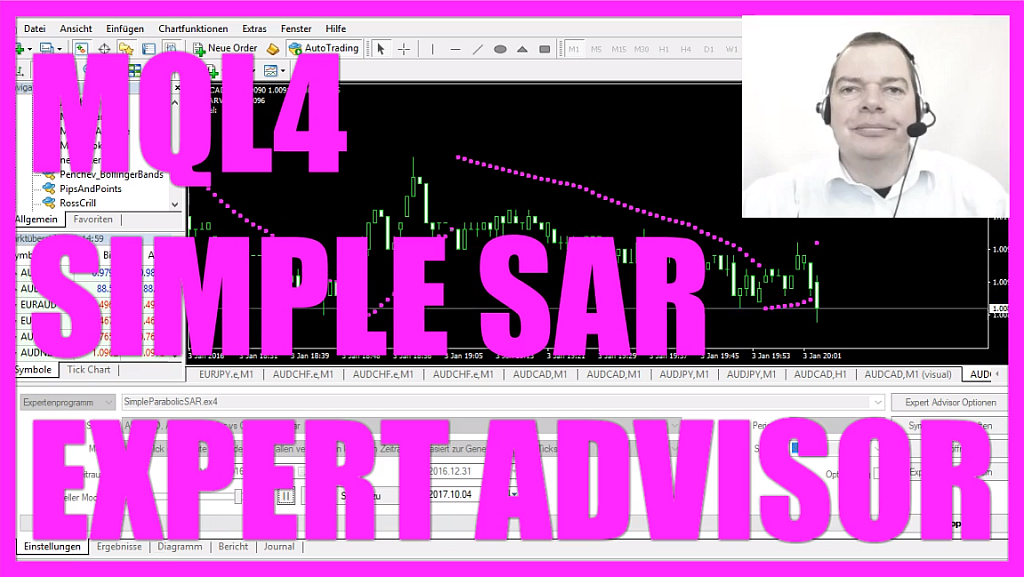
In this video we are going to create an Expert Advisor that uses the parabolic SAR indicator you see to create buy or sell signals here. Whenever these little dots here are below the current price, that would be a buy signal like right now, and when the direction changes like here and the dots appear above the price, that’s a sell signal.
Now how can we create an Expert Advisor that is able to produce buy and sell signals based on this indicator here?
To do that please click on the little button over here or press F4 in your Metatrader. Now you should see the Metaeditor window here. Here you want to click on “File/ New/ Expert Advisor (template)” from template. Continue. I will call this one: Simple Parabolic SAR (SimpleParabolicSAR). Continue and finish. Now you can delete everything above the “OnTick” function and the two comment lines here.
The first step is to create a string variable, we need it for the signal, so it’s also called: “signal” and we do not assign any value here because we are going to calculate the value later on.
Now let’s actually calculate the SAR indicator, that is done by using the built in iSAR function. The first parameter will be the current symbol on the chart, the second parameter is the period, and you might ask yourself what these two values here mean? Well if you click on to: “Insert /Indicators /Trend /Parabolic SAR” you will see that the parabolic SAR indicator has a stat value of 0.02 and a max value of 0.2.
This is actually what we use here 0.02 equals the step value and 0.2 equals the max value.
The last parameter here is for a shift, but we don’t want to shift the indicator value to the right or to the left so we use zero.
Now let’s find out if the SAR indicator is below the bid price because we know when it’s below, that’s an indicator for an uptrend and in MQL4 we simply use an “if” statement to find out if the SAR value we have calculated here is below the bid price. If that is the case that would be a buy signal, so let’s assign the word “buy” to the variable signal we have created here.
In the other case if the SAR indicator is above the ask price – that would be the case here – and it would be a little sell trend and to find out if that is the case we would use the “if” statement and find out if “MySARValue” is above the current ask price.
In that case we would have a sell signal, so let’s assign the word sell to the signal variable we have created. And last but not least we want to create a chart output, so we use the built-in command function to output the text: “MySARValue”, followed by the calculated value. This backslash “n” (“/n”) statement creates a new line for the output, and in the second line we want to output the word: “signal” followed by the calculated signal.
Okay that’s it!
Don’t forget the closing bracket here and when you are finished you can click on the compile button here or press F7 on your keyboard – Oh! I’ve accidentally out commented the “OnTick” function so let’s recompile the code here, and now it says we don’t have any errors and we have no warnings, and if that is the case for you, you can click on a little button here to go back to Metatrader.
In Metatrader we use a little trick please click on “Insert /Indicators /Trend /Parabolic SAR”.
Okay.
Now right click into the template, select template, and save the template as: “tester.tpl” because the tester template is what Metatrader 4 is going to use for your back test.
Let’s click on save and select “View/ Strategy Tester” or press CTRL and R and in the Strategy Tester you want to select the “SimpleParabolicSAR.ex4” file. Don’t forget to enable the visual mode here and now click on start. And this is our little Expert Advisor at work, right now the dots are below the candles and it says we have a buy signal, and when it’s going down the dots are above the candles, we will create a sell signal on the chart.
Okay.
Now you know how to create an Expert Advisor that is able to create buy or sell signals based on the parabolic SAR indicator on your chart and you have created it yourself with a few lines of MQL4 code.

Not sure what to do? Click on the automated trading assistant below

- MQL4 TUTORIAL - SIMPLE BULLS POWER EXPERT ADVISOR
- MQL4 TUTORIAL - SIMPLE EMA EXPERT ADVISOR
- MQL4 TUTORIAL - SIMPLE MODULAR EXPERT ADVISOR
- MQL4 TUTORIAL BASICS - 125 SIMPLE ATR SELL TRAILING STOP
- MQL4 TUTORIAL - SIMPLE SELL LIMIT EA
- MQL4 TUTORIAL - SIMPLE SMA STANDALONE EXPERT ADVISOR
- MQL4 TUTORIAL - SIMPLE BOLLINGER BANDS EXPERT ADVISOR
