

In this video, we are going to find out the lowest of the last one hundred candles and we are also going to draw a horizontal line below it, so let’s find out how to do that with mql4.
To get started please click on the little button here or press F4 on your keyboard, now you should see the Metaeditor window and here until you want to click on file, new, expert advisor from template, continue, I will call this file simple lowest candle, click on continue, continue and finish, now we can delete everything above the on tick function and the to comment lines here.
First, we want to find the lowest of the last one hundred candles, that will be the number of the lowest candle and it will be assigned to a variable that is also called lowest candle, we can get the candle number by using i lowest. I lowest is a function that returns the lowest value over a specific number of bars. In our case we pass the parameters for the current symbol on the chart and the selected period on that chart, the next parameter is mode underscore low – all in capital letters – mode underscore low stands for the lowest price in the candle, we want to have the lowest candle number for one hundred candles and the last parameter here is the starting point or the starting index as they call it, and the starting point in our case will be the current candle zero, now we use object delete for our line that we are going to draw, that might seem a little strange but in case we have already a line on the chart we first want to delete the old one, and afterwards we use object create to create a new one.
This object will be called line, that’s a string value for the name of the object, that can be anything you like, the second parameter is the kind of object we are going to use, I’m using obj h-line here – all in capital letters –, let’s mark that and press F1 and you will see that it stands for a horizontal line, there are several other object types available, depending on what kind of object you are going to draw you will need to pass different parameters.
In our case for the horizontal line the third parameter here is for the sub-window we are going to use, zero stands for the main window so the horizontal line will be drawn on our main chart, oscillators like the MACD are often drawn below the main chart.
The next parameter is the anchor point, we want to start to draw the horizontal line, right away from candle zero – that’s the current candle – and it should be drawn at the lowest price of the lowest candle within our hundred candles.
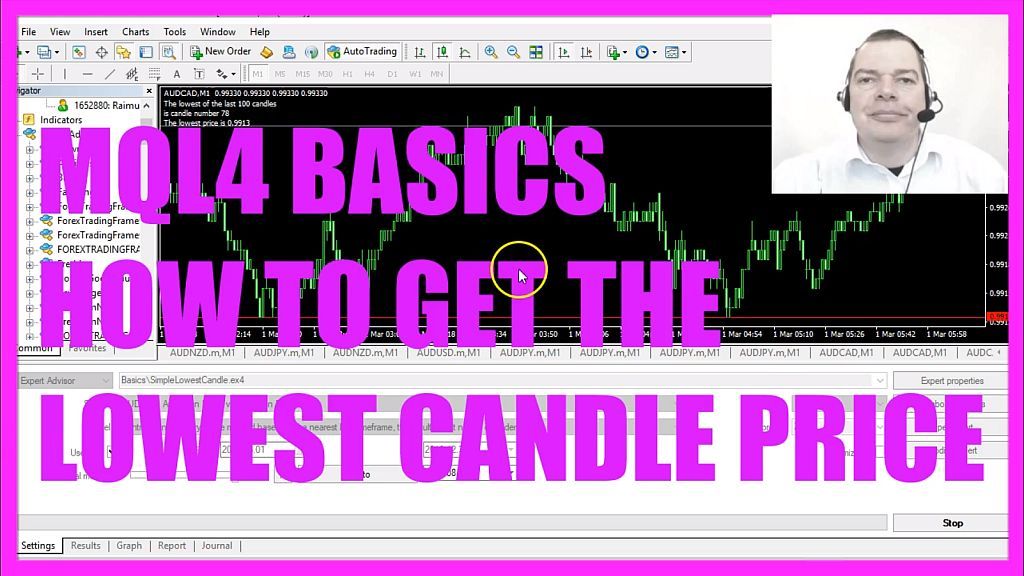
Finally, we add a chart output using the comment function, this will create the output “The lowest of the last one hundred candles”, “is candle number” followed by the calculated number for the lowest candle, and in a line below we want to see “The lowest price is” and the calculation for the lowest price within that one hundred candles.
Please don’t forget the closing bracket here and that’s basically it.
If you don’t know what all the code here does or if this was too fast for you, maybe you want to watch one of the other basic videos in this video series first or maybe even the premium course might be interesting for you, you can find that one on the website but if you are done you can now click on the compile button, you shouldn’t get any errors and if that is the case please click on the little icon here or press F4 to go back to Metatrader.
And in Metatrader we click on view, strategy tester or press control and r, please pick the new file simple lowest candle dot ex4, enable the visual mode here and start a test.
And here we are! The expert advisor is running, we see the horizontal line is drawn below the lowest candle, the output also is working and in this little video you have learned how to calculate the lowest of the last one hundred candles and you have done it yourself with a few lines of mq4 code.

Not sure what to do? Click on the automated trading assistant below

- MQL4 TUTORIAL - SIMPLE SAR EXPERT ADVISOR
- MQL4 TUTORIALBASICS - 128 SIMPLE LONG TERM TREND
- MQL4 TUTORIAL - SIMPLE MODULAR EXPERT ADVISOR
- MQL4 TUTORIAL - SIMPLE SMA STANDALONE EXPERT ADVISOR
- MQL4 TUTORIAL - SIMPLE POSITION MULTIPLIER
- MQL4 TUTORIAL BASICS 127 - SIMPLE ELLIPSE OBJECT
- MQL4 TUTORIAL BASICS - 121 SIMPLE RSI SELL STOP LOSS
- MQL4 TUTORIAL - SIMPLE MOVING AVERAGE SHIFT
