

In this video we are going to create an expert advisor that is able to draw a line object from the highest candle to the high of the current candle, so let’s find out how to do that with mql4.
To get started please click on a little icon here or press here or press F4 on your keyboard, now you should see the Metaeditor window and here you want to click on file, new file, expert advisor from template, continue, I will call this file, simple high price line, click on continue, continue and finish.
Now you can delete everything above the ontick function and the two comment lines here.
As we only want to draw a line for the visible candles on the chart we first need to calculate the number of candles on the chart and that can be done by using the function, window first visible bar that will return the index of the first visible bar in the current chart window and we will store that value in the variable called, candles on chart and that makes it possible to calculate the highest candle. We can do that by using the function ihighest, and ihighest will return the shift of the maximum value over a specific number of bars depending on type.
So what does that mean?
Well, for the current chart and the currently selected period on that chart, we use mode underscore high and if you mark that you will learn that it will give us the highest prices for each candle, and we want to do that for all the candles on the chart starting with the current candle that is candle zero, and the result will be stored in the variable called, highest candle, this is actually the number of the highest candle, not the value.
Now let’s continue and use object delete. At the very first time, we will not have such an object but afterwards, we want to delete the old line and draw a new one each time the price changes and to do that we use object create, this will take a few parameters, so let’s go through the values one by one.
The first parameter stands for the current chart, the second parameter is the name for the object in our case we use simple high line trend, you could use any name you want but you need to use the same name everywhere. Parameter three is obj underscore trend and if we mark that and press F1 we see that it is an object type for a trend line. There are lots of other object types. Depending on the type you want to draw you would need to pass other parameters, we want our object line to be drawn in the main window that is windows zero – that’s the window with the candles – if you like to use oscillators like the MACD you know that oscillators are shown in a separate window below the candles. And the line should start at the time of the highest candle, this is the timeline, these are the values and the first point for our line is the time of the highest candle on the chart, and in the next parameter we say that we want it actually to start at the highest price of the highest candle on the chart, the line should be drawn to the point in time where we have the current candle zero, and actually, we want to go it through the highest price of candle zero.
That’s it for the object create part.
Now let’s change some properties, we use object set integer for the current chart and the object that is called simple high line trend to change the object property color and I would like to see a red line.
In the next step we do almost the same, we once again use object set integer for the current chart and the same object name but this time we want to change the object property style, I use style underscore solid, if you mark that and press F1 you will see that this will give us a solid line, we also could use a dashed or a dotted line and there are a few other styles here.
The next parameter is called object property width that’s the line thickness, I have set it to one and here is one that is called object property ray, this is a little bit different and it will help us to draw the line from the highest candle through the current candle and into the future, so that’s about it.
If you have no idea what all the code here does or if you think that this was too fast for you maybe you want to watch one of the other videos in this basic video series or maybe even the premium course on our website might be interesting for you for now please click on the compile button or press F7 on your keyboard that should work without any errors and if that is the case you can click on a little button here or press F4 to go back to Metatrader.
And in Metatrader you want to open a clean chart, right-click into the chart and select template, save template and save the current template as tester dot tpl, you can overwrite the current one because tester dot tpl is what we are going to see in the strategy tester.
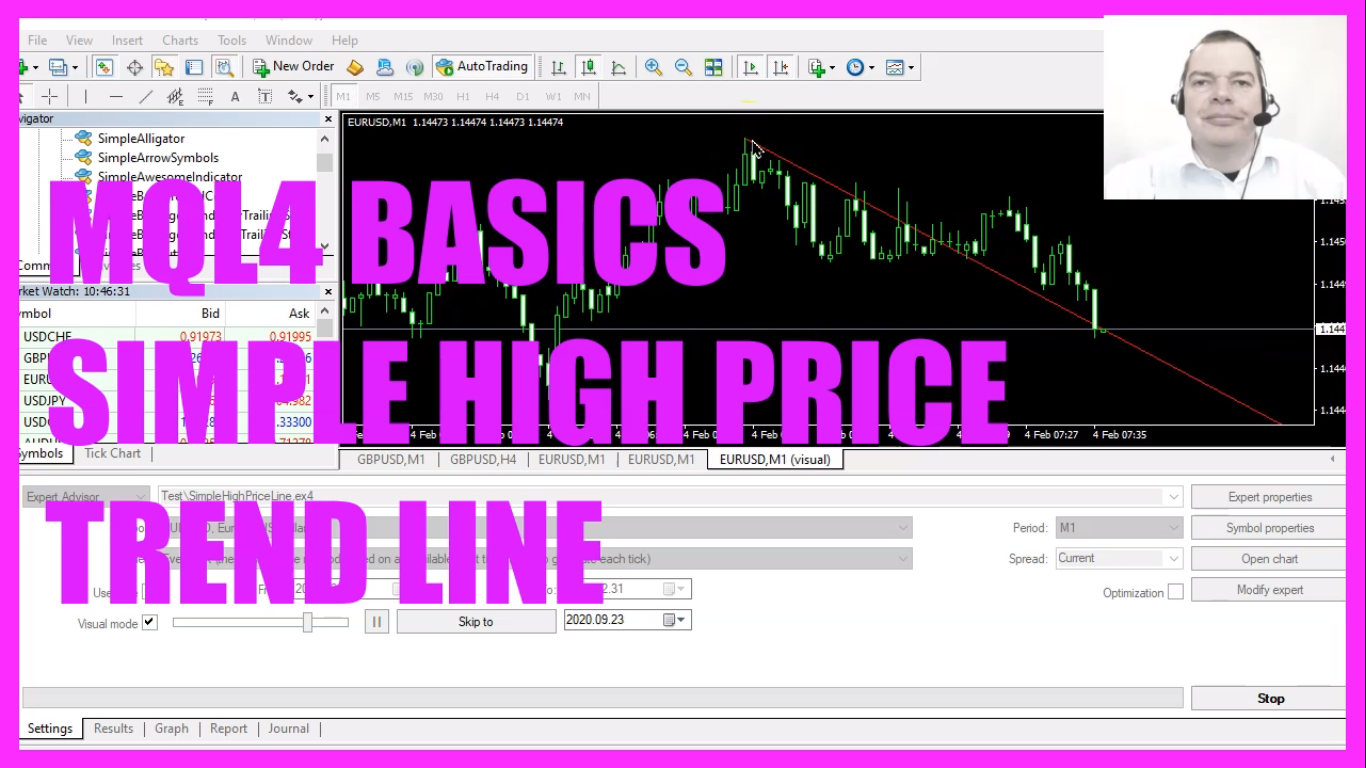
So let’s click on view, strategy tester or press control and r, please pick the new file, simple high price line dot ex4, mark the option for the visible mode here and start a test.
Here we are! The expert advisor actually is working, we see that the line is drawn from the highest candle on the chart right through the high price of the current candle, it also works when we zoom out or when we zoom in, and in this little video you have learned how to create a line object to draw a current price trend based on the highest prices and you have coded it yourself with a few lines of mql4 code.

Not sure what to do? Click on the automated trading assistant below

- MQL4 TUTORIAL BASICS - 129 SIMPLE BOLLINGER BANDS…
- MQL4 TUTORIAL - SIMPLE SELL LIMIT EA
- MQL4 TUTORIAL - SIMPLE ACCELERATOR EXPERT ADVISOR
- MQL4 TUTORIAL BASICS 127 - SIMPLE ELLIPSE OBJECT
- MQL4 TUTORIAL BASICS - 114 SIMPLE SHIFTED PRICE EA
- MQL4 TUTORIAL - SIMPLE BULLS POWER EXPERT ADVISOR
- MQL4 TUTORIAL - SIMPLE RECTANGLE OBJECT
- MQL4 Tutorial - Simple Order Close EA
