

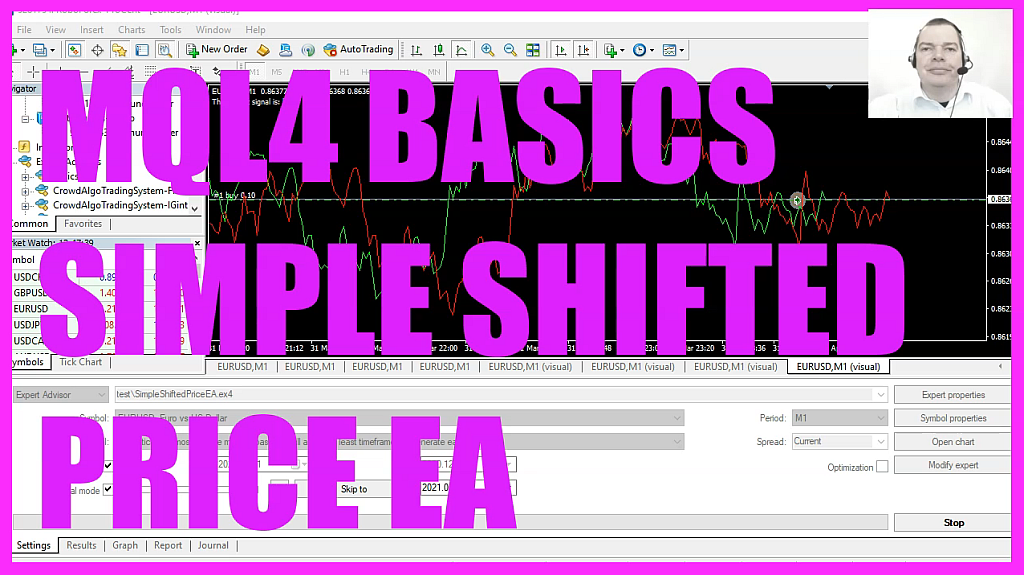
In this video, we are going to create an Expert Advisor that is able to trade price data from a shifted line chart. So let’s see how that can be done with MQL4. To get started, please click on a little icon here or press F4 on your keyboard. Now, you should see the Metaeditor window and here you want to click on file, new file, Expert Advisor from template, continue. I will call this file simple shifted price EA, click on Continue, continue and finish.
Now you can delete everything above the Ontick function and the two comment lines here. We start by creating a string variable called signal. What? We are not going to assign a value here because we want to calculate the signal later on. In the next step, we are going to use the integrated. IMA function that comes with MQL5, for the current symbol on the chart and the currently selected period. I would like to calculate an SMA for one candle and that should be drawn twenty candles ahead of the current time.
We are using mode SMA, the result should be calculated based on the close price. And this last one here is the candle number, we are going to calculate it for the current Candle zero. Well, when you cut this out here, you will see that the value is called MA shift. The last one here is also a shift value, and it’s hard to understand for beginners. But this shift value here is the one to draw the values on the chart.
And this shift value at the end is used to define for which candle you want to do that. Actually, this line chart here is the same as the simple moving average that we draw into the future. You can see the identical movements here and now we can check if the moving average value is below the close price for Candle zero. If that is the case, we consider that to be a Buy signal. So we assign the word buy to our signal.
In the other case, if the moving, average, value is bigger than the close price for Candle zero, that would be a Sell signal and that’s when we assign sell to our signal. And if our signal equals buy and the return value for OrdersTotal is zero, that would mean we have no open orders and a buy signal. And that’s when we use Ordersend to buy 10 Microlot. Otherwise, if the signal equals sell and OrdersTotal is also zero, that means we have no open orders and a sell signal and that’s when we use Ordersend to sell 10 Microlot.
Finally, I would like to add a comment output for the chart. That will show us the text “the current signal is” followed by the calculated signal. That’s about it. If this was too fast for you or if you have no idea what all the code here does, maybe you want to watch one of the other videos in this basic video series, or maybe even the Premium Course on our website might be interesting for you. That’s why we also have links to the shop to download source codes like this one.
But for now, please click on the Compile button or press F7 on your keyboard. You shouldn’t get any errors here. And if that is the case, you can click on a little button here or press F4 to go back to Metatrader. And in Metatrader, please pick an empty chart, switch to the line chart view, that can be done by pressing ALT and 3, or clicking the little button here. So you have a single line chart, now.
Now, right click into the chart, select template, save template and save it as tester.tpl. You can override the current one. Tester.tpl is what we will see when we start the strategy tester. So let’s do that and click on View, strategy tester or press Control and R. Please pick the new file. Simple shifted price .EX4, mark the option for the Visual mode and start your test. Now you will see that the second moving average is not shown on the chart.
So let’s stop the test. And here it is. Now right click again. Select Template, save template and save this one as tester.tpl. And when you restart the test, you will see now are both lines on the chart. Currently we have a buy signal and this is our first position. Let’s speed that up a little bit. And once we see a cross over, the signal is now switching to sell, so our little Expert Advisor is working.
And in this little video, you have learned how to create an Expert Advisor for line charts that are based on price data. And you have coded it yourself with a few lines of MQL4 code.

Not sure what to do? Click on the automated trading assistant below

- MQL4 TUTORIAL - ADVANCED SMA EXPERT ADVISOR
- MQL4 TUTORIAL BASICS - 126 SIMPLE RUNNING TIMER
- MQL4 TUTORIAL - SIMPLE CHART CLICK EVENT
- MQL4 TUTORIAL BASICS - 115 SIMPLE ENVELOPES BUY…
- MQL4 TUTORIAL - SIMPLE POSITION MULTIPLIER
- MQL4 TUTORIAL - SIMPLE SAR EXPERT ADVISOR
- MQL4 TUTORIAL - SIMPLE WPR EXPERT ADVISOR
- MQL4 TUTORIAL - SIMPLE SELL LIMIT EA
