

In this video, we are going to create a dynamic object, it’s a triangle object, and it will change the shape whenever the prices change. So let’s find out how to do that with MQL4. To get started, please click on a little icon here or press F4 on your keyboard. Now you should see the Metaeditor window. And here you want to click on file, new file, Expert Advisor from Template continue. I will call this file Simple Triangle Object.
Click on continue, continue and finish. Now we can delete everything that is above the ontick function and let’s also delete the two comment lines here. First, we want to calculate the highest of the last thirty candles. That can be calculated by using the function ihighest because ihighest is a function that will return the maximum value over a specific number of bars. In our case, for the current symbol on the chart and the currently selected period on that chart, we use ModeHigh because ModeHigh will give us the highest prices of the candles.
We want to do that for 30 candles and the starting point is candle zero. If we cut that out, we will see that this is the starting index. Now, let’s repeat the whole process. This time we want to calculate the lowest of the last 30 candles. And this can be done by using Ilowest. For the current symbol on the chart and the currently selected period on that chart. This time, we are going to use ModeUnderscoreLow. Also for 30 candles, starting with Candle zero, and before we start to draw our object, we want to use object_delete, and that will remove any former objects with the same name from our chart.
We will use the name Triangle for our object. And the very first time we start the code, we will not have anything to delete. But afterwards we want to make sure that former objects are removed before we draw the new one. Now we can actually create the object by using object_create. This function takes a lot of different parameters and depending on the object type you use, you might need to use different parameters. We are going to create an object that is called triangle.
This is the object type, it’s OBJ triangle, and if you mark that and press F1, you will see that there are also lots of different other object types. We are going to use this one. This will draw a shape like this on our chart. We want to draw the object on our main chart. That’s the chart with the candles. And the triangle needs three reference points. The first one is the point in time where we have candle 30.
The anchor point for our triangle will be the close price for candle thirty.
It will be drawn until the time where we have the lowest candle and therefore the lowest price of the lowest candle. And the other side should be drawn to the point in time where we have the highest of the last 30 candles and the reference point will be the highest price of the highest candle. It’s actually possible to reformat the whole statement. So now it is not so hard to read anymore, and that’s about it. If this was too fast for you or if you have no idea what all the code here does, maybe you want to watch one of the other videos and the basic video series or maybe even the Premium Course on our website might be interesting for you.
For now, please click on the Compile button here or F7 on your keyboard. You shouldn’t get any errors.
And if that is the case, you can click on a little button here or press F4 to go back to Metatrader.
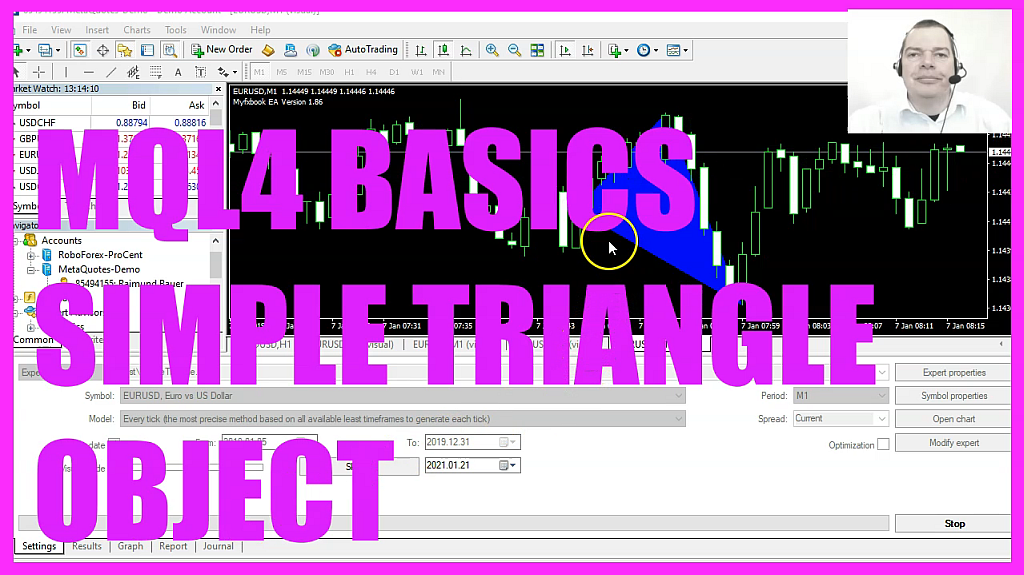
And in Metatrader you want to click on View Strategy tester. Or press Control and R. Please pick the new file. Simple triangle object dot EX4 mark the option for the visual mode and start your test. And here we are. We have a triangle object on the chart. We can also speed up the whole thing, and whenever the prices change, we see that the object is readjusted or in our case, it’s deleted and we draw a new object. So in this little video, you have learned how to create a dynamic triangle object and you have coded it yourself with a few lines of MQL4 code.

Not sure what to do? Click on the automated trading assistant below

- MQL4 TUTORIAL BASICS - 122 SIMPLE AVERAGE TRUE RANGE…
- MQL4 TUTORIAL - SIMPLE RECTANGLE OBJECT
- MQL4 TUTORIAL - SIMPLE CHART CLICK EVENT
- MQL4 TUTORIAL BASICS - 113 SIMPLE SELL PERCENTAGE RISK
- MQL4 TUTORIAL - SIMPLE BOLLINGER BANDS EXPERT ADVISOR
- MQL4 TUTORIAL - SIMPLE ACCELERATOR EXPERT ADVISOR
- MQL4 TUTORIAL BASICS - 126 SIMPLE RUNNING TIMER
- MQL4 TUTORIAL BASICS - 114 SIMPLE SHIFTED PRICE EA
