

In this video, we are going to create an expert advisor that is able to calculate buy and sell signals based on two shifted moving averages, so let’s find out how to do that with mql4.
To get started please click on a little icon here or press F4, now you should see the Metaeditor window and here you want to click on file, new file, expert advisor from template, continue, I will call this file simple shifted ema, click on continue, continue and finish.
Now you can delete everything above the ontick function and the two comment lines here, we start with a few user-defined variables, these are input variables, if you mark that and press F1 you will learn that these are variables that can be changed while the program is running, you don’t have to recompile the code, you can change the settings inside of the inputs tab.
The first value is for the number of candles that we are going to use to calculate the exponential moving average, the second one is a shift value, that’s twenty and we have another shift value one hundred and what those shift areas do is they move the moving average to the right side ahead of the price movement. When we zoom into the chart you can see that we have two moving averages that are similar but they are shifted to the right side, the first one is shifted twenty candles into the future and the second one one hundred candles into the future.
Inside of the on tick function, we create a string variable for the signal but we don’t assign any values here because we are going to calculate them now.
Let’s start with the first moving average. We use the included ima function that comes with mql4 for the current symbol on the chart and the currently selected period on that chart, we use the number of candles that we have defined here so this one will be for twenty candles, the next one is the shift value that we have defined here, that’s also for twenty candles. We are going to use mode ema that stands for exponential moving average, the values should be calculated based on the close price and we are always going to calculate the current candle value.
Well, if you mark the ima function and press F1 you will see that we have two shift values, this one, and this one that might look a little bit confusing but it’s not so hard to understand. This one is where you draw the moving average so in our case we draw it on the right side of the chart and this shift value here is for the candle number that should be calculated and we are going to calculate the current candle number so we are using a shift value of zero for this parameter.
Let’s repeat the whole process but this time we are going to calculate it for the second moving average but this one will use the value shift two and that is one hundred candles and that’s why it is moved far to the right side ahead of the price movement.
We want to buy if the price is above both ema’s so if the bit price is bigger than the first moving average and if the bid price is bigger than the second moving average that’s when we want to buy so now we assign the word buy to our signal. In the other case if the current bid price is below the first moving average and if the bid price is also below the second moving average that is when we want to sell and if this is true we are going to assign the word sell to our signal.
When our signal equals buy and the return value for orders total is zero that would mean we have no open orders and a buy signal and in that case, we use order send to buy ten micro lot.
Otherwise, if the signal equals sell and we have no open orders we use order send to sell ten micro lot.
Finally, we want to add a comment statement that should output the text, the current signal is, followed by the calculated signal.
Okay, that’s about it!
If you don’t understand what all the code here does or if this was too fast for you maybe you want to watch one of the other videos in this basic video series or maybe even the premium course might be interesting for you you can find that one on our website but for now please click on the compile button…
I messed something up here. Oh, I see!
I need to delete this curly bracket here.
And this time it worked and if this is the case you can click on a little button here or press F4 to go back to Metatrader.
And in Metatrader we need to modify a chart window, let’s pick the line chart here, click on insert, indicators, trend, moving average, I would like to have a period for twenty candles, a shift value of twenty, the moving average method should be exponential and I would like the moving average to be calculated based on the close price.
Let’s pick a color and click okay, here is the first moving average!
Let’s repeat that! Click on insert, indicators, trend, moving average. This time we want to have a shift value of one hundred candles and a different color, let’s confirm that, right-click into the chart, select template, save template and save it as tester dot tpl because this is the template that is going to be used by the strategy tester. let’s click on save, overwrite the current one and if you don’t see the strategy tester panel here you can click on view, strategy tester or press control and r, please pick the new file simple shifted ema dot ex4, mark the option for the visual mode here and start a test.
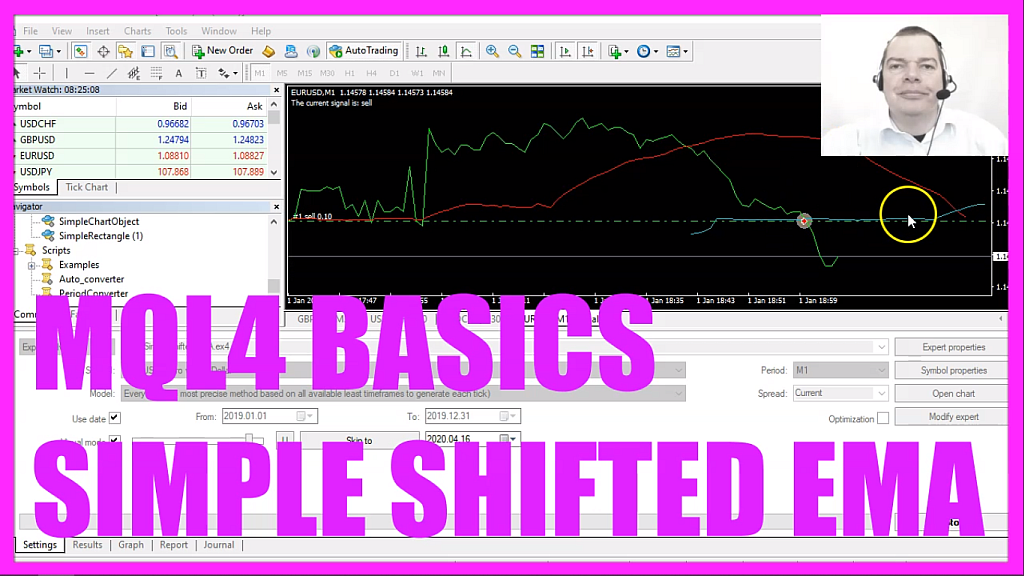
Here we are! Our expert advisor is working, we now have a sell signal because the price movement is below both moving averages and when the price is above both moving averages we should see a buy signal here, let’s forward the whole thing and this also seems to work and in this little video you have learned how to create an expert advisor that is able to calculate two exponential moving averages that are shifted into the future and you have coded it yourself with a few lines of mql4 code.

Not sure what to do? Click on the automated trading assistant below

- MQL4 TUTORIAL - SIMPLE BOLLINGER BANDS EXPERT ADVISOR
- MQL4 TUTORIAL - ADVANCED SMA EXPERT ADVISOR
- MQL4 TUTORIAL - SIMPLE EMA EXPERT ADVISOR
- MQL4 TUTORIAL BASICS - 121 SIMPLE RSI SELL STOP LOSS
- MQL4 TUTORIAL - SIMPLE SAR EXPERT ADVISOR
- MQL4 TUTORIAL BASICS - 126 SIMPLE RUNNING TIMER
- MQL4 TUTORIAL - 131 STANDALONE EMA MACD EXPERT ADVISOR
- MQL4 TUTORIAL BASICS - 114 SIMPLE SHIFTED PRICE EA
